

SITCOMTN-139
WET-006: pairing vs stacking for wavefront estimation#
In this document we compare two approaches for wavefront estimation for the Rubin Observatory Active Optics System (AOS). The first (default) approach, dubbed “pairing”, is using individual donut pairs and averaging their final Zk estimate. The second approach (“stacking”) involves aggregating individual donut stamps prior to wavefront fitting and using their combined information (a stacked stamp) to obtain a single set of Zernike polynomials per stacked donut image. For an overview of pairing vs stacking, also see https://sitcomtn-085.lsst.io/.
Last verified to run: 09/19/2024
Versions:
lsst_distrib w_2024_32 (ext, cvmfs)
ts_wep v11.4.0
Setup on USDF#
We import all required packages:
import matplotlib.pyplot as plt
from matplotlib import colormaps as cmaps
from astropy.table import Table
from astropy.visualization import ZScaleInterval
from astropy.io import fits
from lsst.daf import butler as dafButler
import numpy as np
from lsst.ts.wep.utils import (
    WfAlgorithmName,
    getTaskInstrument,
    getCameraFromButlerName
)
from lsst.ts.wep.image import Image
import stacking
import os
Data processing#
The data was processed by running first ISR (lsstPipelineISRdoVar.yaml ):
description: run ISR on raws
instrument: lsst.obs.lsst.LsstCam
tasks:
  isr:
    class: lsst.ip.isr.isrTask.IsrTask
    config:
      connections.outputExposure: 'postISRCCD'
      doBias: False
      doVariance: True
      doLinearize: False
      doCrosstalk: False
      doDefect: False
      doNanMasking: False
      doInterpolate: False
      doBrighterFatter: False
      doDark: False
      doFlat: False
      doApplyGains: True
      doFringe: False
      doOverscan: True
      python: OverscanCorrectionTask.ConfigClass.fitType = 'MEDIAN'
Then WEP donut direct detection and cutout (lsstPipelineDirectCutoutOnly.yaml):
description: detect and cutout donuts
instrument: lsst.obs.lsst.LsstCam
tasks:
  generateDonutDirectDetectTask:
    class: lsst.ts.wep.task.generateDonutDirectDetectTask.GenerateDonutDirectDetectTask
    config:
      donutSelector.useCustomMagLimit: True
  cutOutDonutsCwfsTask:
    class: lsst.ts.wep.task.cutOutDonutsCwfsTask.CutOutDonutsCwfsTask
Then separately using the donut postage stamps to obtain Danish-based (lsstPipelineCalcDanishOnly.yaml):
description: calculate Zernikes with Danish
instrument: lsst.obs.lsst.LsstCam
tasks:
  calcZernikesTask:
    class: lsst.ts.wep.task.calcZernikesTask.CalcZernikesTask
    config:
       python: |
          from lsst.ts.wep.task import EstimateZernikesDanishTask
          config.estimateZernikes.retarget(EstimateZernikesDanishTask)
or TIE-based wavefront estimation (lsstPipelineCalcTieOnly.yaml):
description: calculate Zernikes with TIE
instrument: lsst.obs.lsst.LsstCam
tasks:
  calcZernikesTask:
    class: lsst.ts.wep.task.calcZernikesTask.CalcZernikesTask
    config:
       python: |
          from lsst.ts.wep.task import EstimateZernikesTieTask
          config.estimateZernikes.retarget(EstimateZernikesTieTask)
The succession of these was run with in a new repo where we first register the instrument, write calibrations, and ingest the raws:
pathCwd = "/sdf/group/rubin/shared/scichris/DM-42718_WET-006"
butlerRootPath = os.path.join(pathCwd, "newRepo")
outputImgDir = (
    "/sdf/data/rubin/user/gmegias/projects/commissioning_sims/WET-001_lsstcam/state_*"
)

cmd1 = f"butler create {butlerRootPath}"

butlerInstName = "Cam"
cmd2 = f"butler register-instrument {butlerRootPath} lsst.obs.lsst.Lsst{butlerInstName}"
cmd3 = f"butler write-curated-calibrations {butlerRootPath} lsst.obs.lsst.Lsst{butlerInstName}"
cmd4 = f"butler ingest-raws {butlerRootPath} {outputImgDir}/amp*"

print(cmd1, "\n")
print(cmd2, "\n")
print(cmd3, "\n")
print(cmd4, "\n")
butler create /sdf/group/rubin/shared/scichris/DM-42718_WET-006/newRepo

butler register-instrument /sdf/group/rubin/shared/scichris/DM-42718_WET-006/newRepo lsst.obs.lsst.LsstCam

butler write-curated-calibrations /sdf/group/rubin/shared/scichris/DM-42718_WET-006/newRepo lsst.obs.lsst.LsstCam

butler ingest-raws /sdf/group/rubin/shared/scichris/DM-42718_WET-006/newRepo /sdf/data/rubin/user/gmegias/projects/commissioning_sims/WET-001_lsstcam/state_*/amp*
Then we run ISR, and each WEP pipetasks separately so that they are in collections that can be reused. Each was run with bps on USDF, with the following prerequisites:
source /sdf/group/rubin/sw/w_latest/loadLSST.bash && setup lsst_distrib
source setup_aos.sh, which contains:
#!/usr/bin/env bash
export PATH_TO_TS_WEP=/sdf/data/rubin/user/scichris/WORK/aos_packages/ts_wep/
export PATH_TO_TS_OFC=/sdf/data/rubin/user/scichris/WORK/aos_packages/ts_ofc/
export PATH_TO_TS_IMSIM=/sdf/data/rubin/user/scichris/WORK/aos_packages/ts_imsim/

eups declare -r $PATH_TO_TS_WEP -t $USER --nolocks
eups declare -r $PATH_TO_TS_OFC -t $USER --nolocks
eups declare -r $PATH_TO_TS_IMSIM -t $USER --nolocks

setup ts_ofc -t $USER  -t current
setup ts_wep -t $USER  -t current
setup ts_imsim -t $USER -t current

export LSST_ALLOW_IMPLICIT_THREADS=True
Then
cd /sdf/group/rubin/shared/scichris/DM-42718_WET-006/
allocateNodes.py -v -n 10 -c 64 -m 60:00:00 -q roma,milano -g 1800 s3df --account rubin:commissioning
isrCollection = "run_isr_all"
cutoutsCollection = "all_states_direct_stamps"
tieCollection = "all_states_direct_TIE"
danishCollection = "all_states_direct_Danish"

isrYaml = "lsstPipelineISRdoVar.yaml"
cutoutYaml = "lsstPipelineDirectCutoutOnly.yaml"
danishYaml = "lsstPipelineCalcDanishOnly.yaml"
tieYaml = "lsstPipelineCalcTieOnly.yaml"

isrYamlPath = os.path.join(pathCwd, isrYaml)
cutoutYamlPath = os.path.join(pathCwd, cutoutYaml)
danishYamlPath = os.path.join(pathCwd, danishYaml)
tieYamlPath = os.path.join(pathCwd, tieYaml)

nCores = 50

cmdIsr = f"bps submit site_bps.yaml  -b  {butlerRootPath} -i  LSSTCam/raw/all,LSSTCam/calib/unbounded \
-o {isrCollection} -p {isrYamlPath} -j {nCores}"


cmdCutout = f"bps submit site_bps.yaml  -b  {butlerRootPath} -i {isrCollection},LSSTCam/calib/unbounded \
-o {cutoutsCollection}  -p {cutoutYamlPath} -j {nCores}"

cmdDanish = f"bps submit site_bps.yaml  -b  {butlerRootPath} -i {cutoutsCollection} \
-o {danishCollection}  -p {danishYamlPath} -j {nCores}"

cmdTie = f"bps submit site_bps.yaml  -b  {butlerRootPath} -i {cutoutsCollection} \
-o {tieCollection}  -p {tieYamlPath} -j {nCores}"

print(cmdIsr, "\n")
print(cmdCutout, "\n")
print(cmdDanish, "\n")
print(cmdTie, "\n")
bps submit site_bps.yaml  -b  /sdf/group/rubin/shared/scichris/DM-42718_WET-006/newRepo -i  LSSTCam/raw/all,LSSTCam/calib/unbounded -o run_isr_all -p /sdf/group/rubin/shared/scichris/DM-42718_WET-006/lsstPipelineISRdoVar.yaml -j 50

bps submit site_bps.yaml  -b  /sdf/group/rubin/shared/scichris/DM-42718_WET-006/newRepo -i run_isr_all,LSSTCam/calib/unbounded -o all_states_direct_stamps  -p /sdf/group/rubin/shared/scichris/DM-42718_WET-006/lsstPipelineDirectCutoutOnly.yaml -j 50

bps submit site_bps.yaml  -b  /sdf/group/rubin/shared/scichris/DM-42718_WET-006/newRepo -i all_states_direct_stamps -o all_states_direct_Danish  -p /sdf/group/rubin/shared/scichris/DM-42718_WET-006/lsstPipelineCalcDanishOnly.yaml -j 50

bps submit site_bps.yaml  -b  /sdf/group/rubin/shared/scichris/DM-42718_WET-006/newRepo -i all_states_direct_stamps -o all_states_direct_TIE  -p /sdf/group/rubin/shared/scichris/DM-42718_WET-006/lsstPipelineCalcTieOnly.yaml -j 50
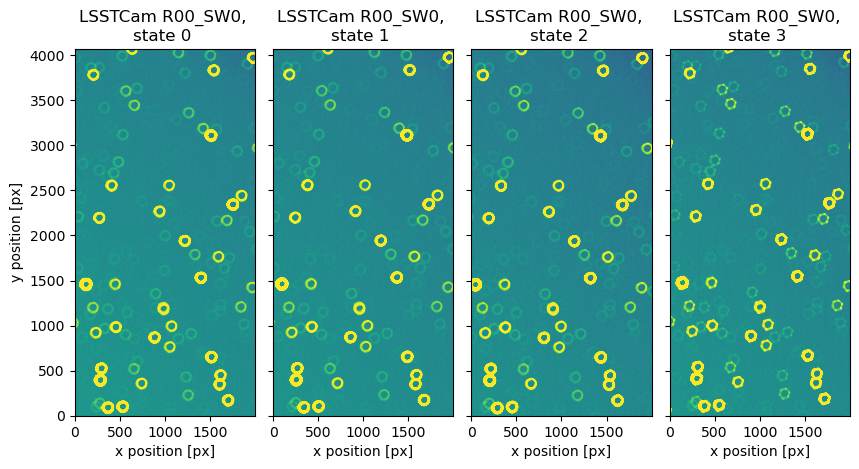
Illustration of WET-001 states#
Note that each state contains randomly drawn modes:
butler = dafButler.Butler(butlerRootPath)
registry = butler.registry
datasetRefs = registry.queryDatasets('postISRCCD',collections=['run_isr_all'],
                                     where=f"instrument='LSSTCam' ").expanded()
print(len(list(datasetRefs)))
dataIds = []
for ref in datasetRefs:
    dataIds.append(ref.dataId)
800
# read in the images:
exposures = {}
for s in range(4):
    exposures[s] = butler.get('postISRCCD',
                      dataId=dataIds[s],
                      collections=['run_isr_all']
                             )
# plot the example exposures
fig, ax = plt.subplots(1, 4, figsize=(10, 5))

zscale = ZScaleInterval()
i = 0
for state, exposure in exposures.items():
    d = exposure.image.array
    vmin, vmax = zscale.get_limits(d)
    mappable = ax[i].imshow(d.T, vmin=vmin, vmax=vmax, origin="lower")

    ax[i].set_title(
        f"{exposure.visitInfo.instrumentLabel} {exposure.detector.getName()}, \nstate {state} ",
    )
    ax[i].set_xlabel("x position [px]")
    i += 1
ax[0].set_ylabel("y position [px]")

for i in range(1, 4):
    ax[i].set_yticklabels([])
fig.subplots_adjust(wspace=0.1)
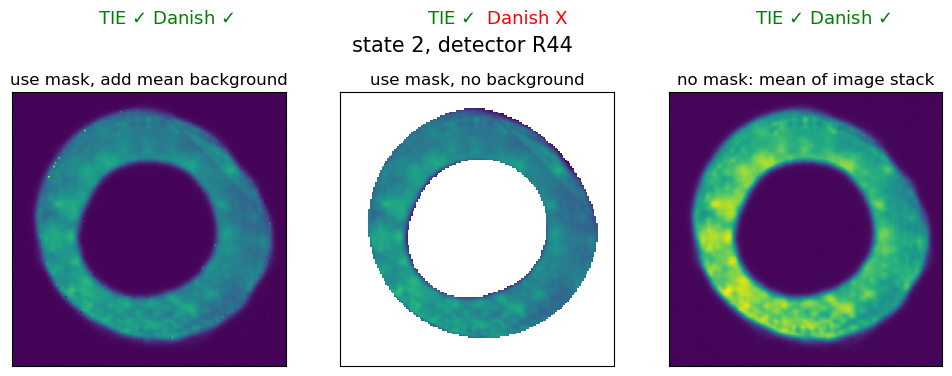
Perform stacking#
Stacking can be performed with the code in the attached stacking.py file. We combine information contained in each stamp on a pixel by pixel basis. If using a donut mask, then only the values inside the mask are combined for the donut component. In that case, the image values outside the mask can be also averaged (left panel below) or set to 0 (middle panel). If not using the donut mask, the mean of the entire stack is calculated (right panel). Each donut contains field coordinates used by WEP to find a mask for wavefront fitting. In stacking, the x,y field coordinates of the stacked donut are a mean of field coordinates of component donuts. We find that for Danish there is a minimum background threshold, which means that it cannot be run entirely without background. TIE works in all conditions, including a donut stack with no background.
butlerRootPath = "/sdf/group/rubin/shared/scichris/DM-42718_WET-006/newRepo"
output_collection = "all_states_direct_stamps"

butler = dafButler.Butler(butlerRootPath)

dataId = {"instrument": "LSSTCam", "detector": 203, "visit": 5024072302002}
stampsIntra = butler.get(
    "donutStampsIntra", dataId=dataId, collections=[output_collection]
)
fig, axs = plt.subplots(1, 3, figsize=(12, 4))
ax = np.ravel(axs)

i = 0
use_mask = True
add_bkgnd = True
# set the file name title
string = "no"
if use_mask:
    string = "use"

bkgnd = "no"
if add_bkgnd:
    bkgnd = "with"
stackedIntra = stack_donut_wep_im_refactor(
    stampsIntra,
    N=len(stampsIntra),
    pixel_stack="nanmean",
    use_mask=use_mask,
    after_avg_fill_with_bkgnd=add_bkgnd,
)
ax[i].imshow(
    stackedIntra["wep_im"].image,
    origin="lower",
)
ax[i].set_title(f"{string} mask, add mean background")

i = 1
use_mask = True
add_bkgnd = False
# set the file name title
string = "no"
if use_mask:
    string = "use"

bkgnd = "no"
if add_bkgnd:
    bkgnd = "with"
stackedIntra = stack_donut_wep_im_refactor(
    stampsIntra,
    N=len(stampsIntra),
    pixel_stack="nanmean",
    use_mask=use_mask,
    after_avg_fill_with_bkgnd=add_bkgnd,
)
ax[i].imshow(
    stackedIntra["wep_im"].image,
    origin="lower",
)
ax[i].set_title(f"{string} mask, {bkgnd} background")

i = 2
use_mask = False
# set the file name title
string = "no"
if use_mask:
    string = "use"

bkgnd = "no"
if add_bkgnd:
    bkgnd = "with"
stackedIntra = stack_donut_wep_im_refactor(
    stampsIntra,
    N=len(stampsIntra),
    pixel_stack="nanmean",
    use_mask=use_mask,
    after_avg_fill_with_bkgnd=add_bkgnd,
)
ax[i].imshow(
    stackedIntra["wep_im"].image,
    origin="lower",
)
ax[i].set_title(f"{string} mask: mean of image stack")
for i in range(3):
    ax[i].set_xticks([])
    ax[i].set_yticks([])

for i in [0, 2]:
    ax[i].text(
        50, 200, "TIE $\checkmark $ Danish $\checkmark $", color="green", fontsize=13
    )
ax[1].text(50, 200, "TIE $\checkmark $", color="green", fontsize=13)
ax[1].text(85, 200, "Danish X", color="red", fontsize=13)
fig.suptitle("state 2, detector R44", fontsize=15)
/tmp/ipykernel_44053/2159255477.py:81: RuntimeWarning: Mean of empty slice
  donutStackedArray = np.nanmean(image_stack, axis=0)
Text(0.5, 0.98, 'state 2, detector R44')
Illustrate the results#
Read all pre-computed stacking results into dictionary
summary = {}
use_mask = True
method = "tie"


stacking_results = {}

# read the results for TIE, use mask, no bkgnd
fname = "wep_direct_stacking_use_mask_tie_no_bkgnd.npy"
stacking_results[0] = {
    "use_mask": True,
    "mask_string": "use",
    "method": "tie",
    "method_string": f"stacking_tie_use_mask",
    "add_bkgnd": False,
    "bkgnd_string": "no",
    "fname": fname,
    "results": np.load(fname, allow_pickle=True).item(),
}

# read the results for {TIE, Danish} x {use / no mask}  ,  with background added (if using mask)
i = 1
for use_mask in [True, False]:
    for method in ["tie", "danish"]:
        add_bkgnd = True

        # set the file name title
        mask_string = "no"
        if use_mask:
            mask_string = "use"

        bkgnd_string = "no"
        if add_bkgnd:
            bkgnd_string = "with"
        fname = (
            f"wep_direct_stacking_{mask_string}_mask_{method}_{bkgnd_string}_bkgnd.npy"
        )
        results = np.load(fname, allow_pickle=True).item()

        method_string = f"stacking_{method}_{mask_string}_mask"

        if mask_string == "use":
            method_string += f"_{bkgnd_string}_bkgnd"

        stacking_results[i] = {
            "use_mask": use_mask,
            "mask_string": mask_string,
            "method": method,
            "method_string": method_string,
            "add_bkgnd": add_bkgnd,
            "bkgnd_string": bkgnd_string,
            "fname": fname,
            "results": results,
        }
        i += 1
Read the pairing results from butler:
butlerRootPath = '/sdf/group/rubin/shared/scichris/DM-42718_WET-006/newRepo'

butler = dafButler.Butler(butlerRootPath)
registry = butler.registry
output_collection = 'all_states_direct_TIE'
datasetRefs = registry.queryDatasets('donutStampsExtra', collections=[output_collection],
                                     where=f"instrument='LSSTCam' and detector.purpose='WAVEFRONT' ").expanded()
print(len(list(datasetRefs)))
refs = []
for ref in datasetRefs:
    refs.append(ref)
print(len(refs))

#stackedIntra
pairing_results = {'tie':{}, 'danish':{}}
for method in pairing_results.keys():
    pairing_results[method] = {}
    for state in range(1,101):
        pairing_results[method][state] = {}

for ref in refs:
    # read in the results of each method
    for method in pairing_results.keys():
        if method == 'tie':
            coll_method = 'TIE'
        else:
            coll_method = 'Danish'
        coll = f'all_states_direct_{coll_method}'
        state = int(str(ref.dataId.visit.id)[-3:])
        raft = ref.dataId.detector.raft

        pairing_results[method][state][raft] =  butler.get('zernikeEstimateRaw',
                          dataId=ref.dataId,
                          collections=[coll])
400
400
Also load OPDs that are used as a reference:
# load all OPDs to a dict
all_opd = {}
for n in range(1,101):#101):
    opdDir = f'/sdf/data/rubin/user/gmegias/projects/commissioning_sims/WET-001_lsstcam/state_{n}'

    hdul = fits.open(os.path.join(opdDir,'opd.fits'))


    opds = {}
    for i in range(len(hdul)):
        opd_zks_1_28 = []
        for key,value in hdul[i].header.items():

            if key.startswith('AZ'):
                #print(key.split('_')[1])
                opd_zks_1_28.append(value)
        opds[i] = opd_zks_1_28
    all_opd[n]  = opds

opd_raft_to_id = {'R00':0, 'R04':1, 'R40':2, 'R44':3}
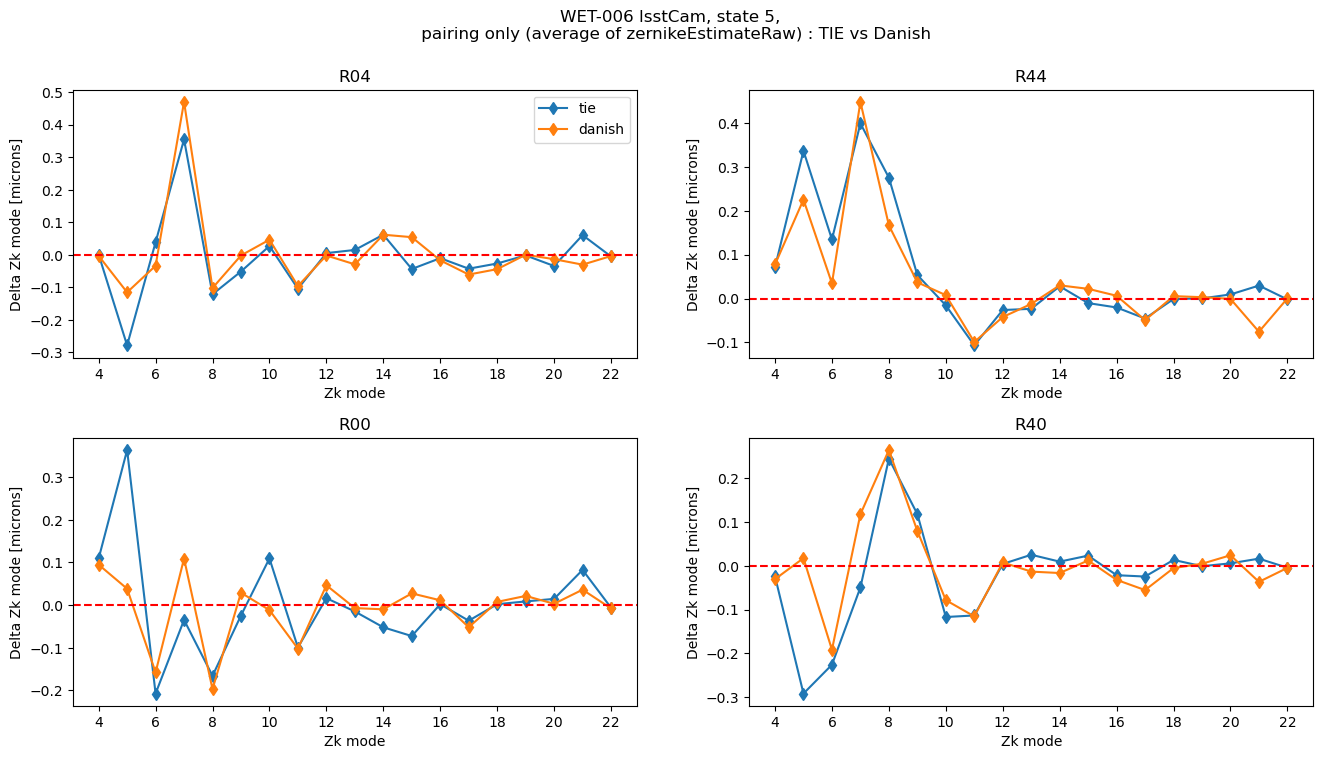
First, compare TIE to Danish for pairing only
rafts = ['R04', 'R44', 'R00','R40']
state=5

fig,axs = plt.subplots(2,2,figsize=(16,8))
ax = np.ravel(axs)
i=0

# this plots  just the pairing results
colors = {'danish':'green',  'tie':'orange'}
for raft in rafts:

    ax[i].set_title(raft )
    opdId = opd_raft_to_id[raft]
    opd_zk = 0.001*np.array(all_opd[state][opdId][3:22])

    for method in pairing_results.keys():
        # plot pairing  raw zks for danish and tie
        zkRaw = pairing_results[method][state][raft]
        avg_zk = np.mean(zkRaw, axis=0)

        rms_diff_avg =  np.sqrt(np.mean(np.square(avg_zk-opd_zk)))
        ax[i].plot(np.arange(4,23), avg_zk-opd_zk, marker='d', label=f'{method}')

    ax[i].set_ylabel('Delta Zk mode [microns]')
    ax[i].set_xlabel('Zk mode')
    ax[i].set_xticks([4,6,8,10,12,14,16,18,20,22])
    ax[i].axhline(0,ls='--', c='red')

    i+=1
ax[0].legend()

fig.subplots_adjust(hspace=0.3)
fig.suptitle(f'WET-006 lsstCam, state {state}, \n pairing only (average of zernikeEstimateRaw) : TIE vs Danish')
Text(0.5, 0.98, 'WET-006 lsstCam, state 5, \n pairing only (average of zernikeEstimateRaw) : TIE vs Danish')
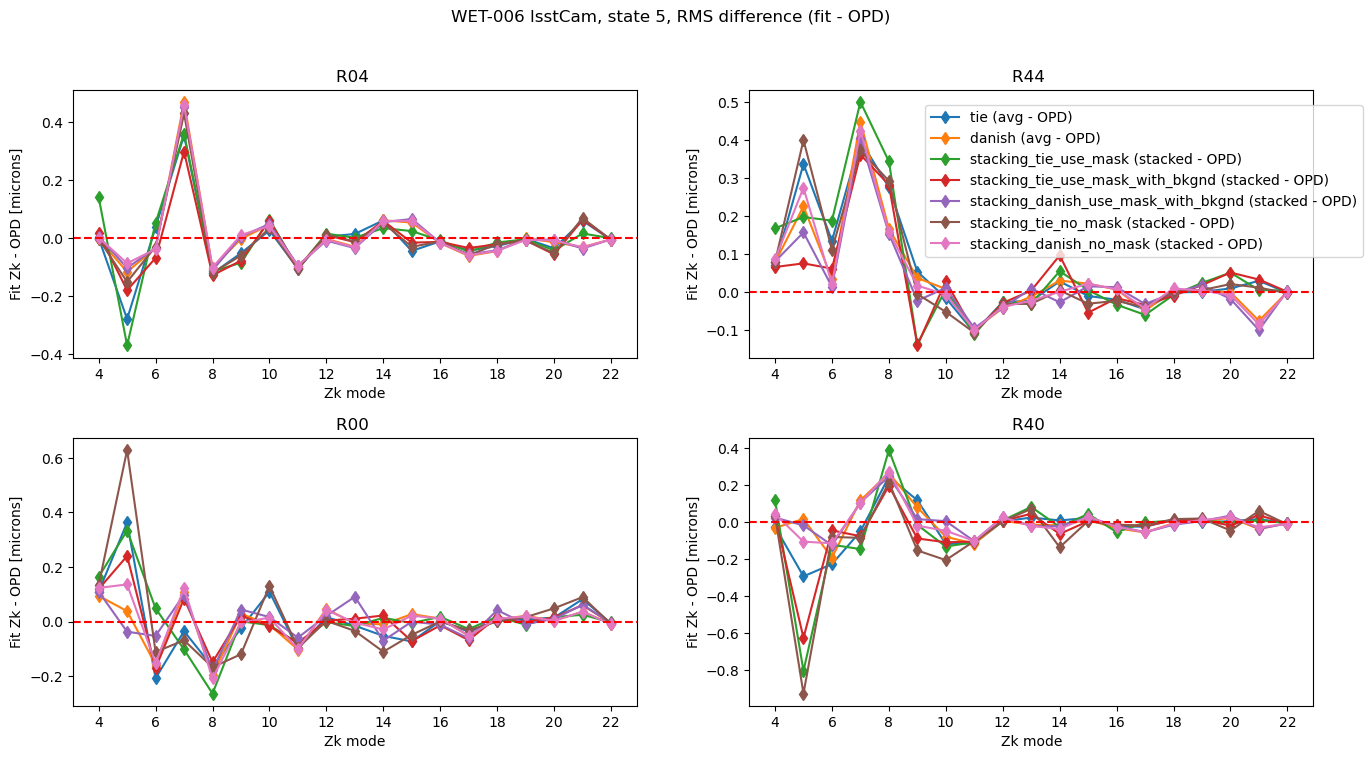
Add to that the stacking results for that particular mode:
state=5

fig,axs = plt.subplots(2,2,figsize=(16,8))
ax = np.ravel(axs)
i=0
# this plots the two sets of  results
colors = {'danish':'green',  'tie':'orange'}
for raft in rafts:

    ax[i].set_title(raft )

    # get OPD for that raft
    opdId = opd_raft_to_id[raft] # in nm
    opd_zk = 0.001*np.array(all_opd[state][opdId][3:22]) # in microns

    for method in pairing_results.keys():
        zkRaw = pairing_results[method][state][raft]
        avg_zk = np.mean(zkRaw, axis=0)
        rms_diff_avg =  np.sqrt(np.mean(np.square(avg_zk-opd_zk)))

        ax[i].plot(np.arange(4,23), avg_zk-opd_zk, marker='d',
                   label=f'{method} (avg - OPD)')

    for method in stacking_results.keys():
        stacked_zk = stacking_results[method]['results'][state][raft]
        label =  stacking_results[method]['method_string']
        rms_diff_stack = np.sqrt(np.mean(np.square(stacked_zk-opd_zk)))
        ax[i].plot(np.arange(4,23), stacked_zk-opd_zk, marker='d',
                   label=f'{label} (stacked - OPD)')

    ax[i].set_title(f'{raft} ')
    ax[i].set_ylabel('Fit Zk - OPD [microns]')
    ax[i].set_xlabel('Zk mode')
    ax[i].set_xticks([4,6,8,10,12,14,16,18,20,22])
    ax[i].axhline(0,ls='--', c='red')

    i+=1
ax[1].legend(bbox_to_anchor=[0.3,0.35])

fig.subplots_adjust(hspace=0.3)
fig.suptitle(f'WET-006 lsstCam, state {state}, RMS difference (fit - OPD) ')
Text(0.5, 0.98, 'WET-006 lsstCam, state 5, RMS difference (fit - OPD) ')
Marginalize this information across all states:
rmss={}

# add stacking results
for j in stacking_results.keys():
    results = stacking_results[j]['results']
    mask_string = stacking_results[j]['mask_string']
    bkgnd_string =  stacking_results[j]['bkgnd_string']
    method =  stacking_results[j]['method']
    method_string = f'stacking_{method}_{mask_string}_mask'

    if mask_string == 'use' :
        method_string += f'_{bkgnd_string}_bkgnd'
    rmss[method_string] = {}
    for raft in rafts:
        rmss[method_string][raft] = []
        opdId = opd_raft_to_id[raft]

        for state in range(1,101):

            opd_zk = 0.001*np.array(all_opd[state][opdId][3:22])

            stacked_zk = results[state][raft]
            rms_diff = np.sqrt(np.mean(np.square(stacked_zk-opd_zk)))


            rmss[method_string][raft].append(rms_diff)

# add pairing results
for algo in pairing_results.keys():
   method_string = f'pairing_{algo}'
   rmss[method_string] = {}
   for raft in rafts:
       rmss[method_string][raft] = []
       opdId = opd_raft_to_id[raft]

       for state in range(1,101):
            opd_zk = 0.001*np.array(all_opd[state][opdId][3:22])
            avg_zk = np.mean(pairing_results[algo][state][raft], axis=0)
            rms_diff =  np.sqrt(np.mean(np.square(avg_zk-opd_zk)))
            rmss[method_string][raft].append(rms_diff)
fig,axs = plt.subplots(2,2,figsize=(16,10))
ax = np.ravel(axs)

for method in rmss.keys():
    i=0
    for raft in rafts:
        ax[i].plot(np.arange(1,101), rmss[method][raft], marker='s', label=f'{method}')
        ax[i].set_title(raft)
        i+=1

    fig.text(0.5,0.06,'state #', fontsize=17)
    fig.text(0.06,0.5,r'RMS ($\Delta$(zk-opd) ) [microns] ', rotation=90, fontsize=17)
fig.suptitle('pairing vs all stacking methods', fontsize=16)
ax[2].legend(bbox_to_anchor=[0.55,.6])
<matplotlib.legend.Legend at 0x7f6653417750>
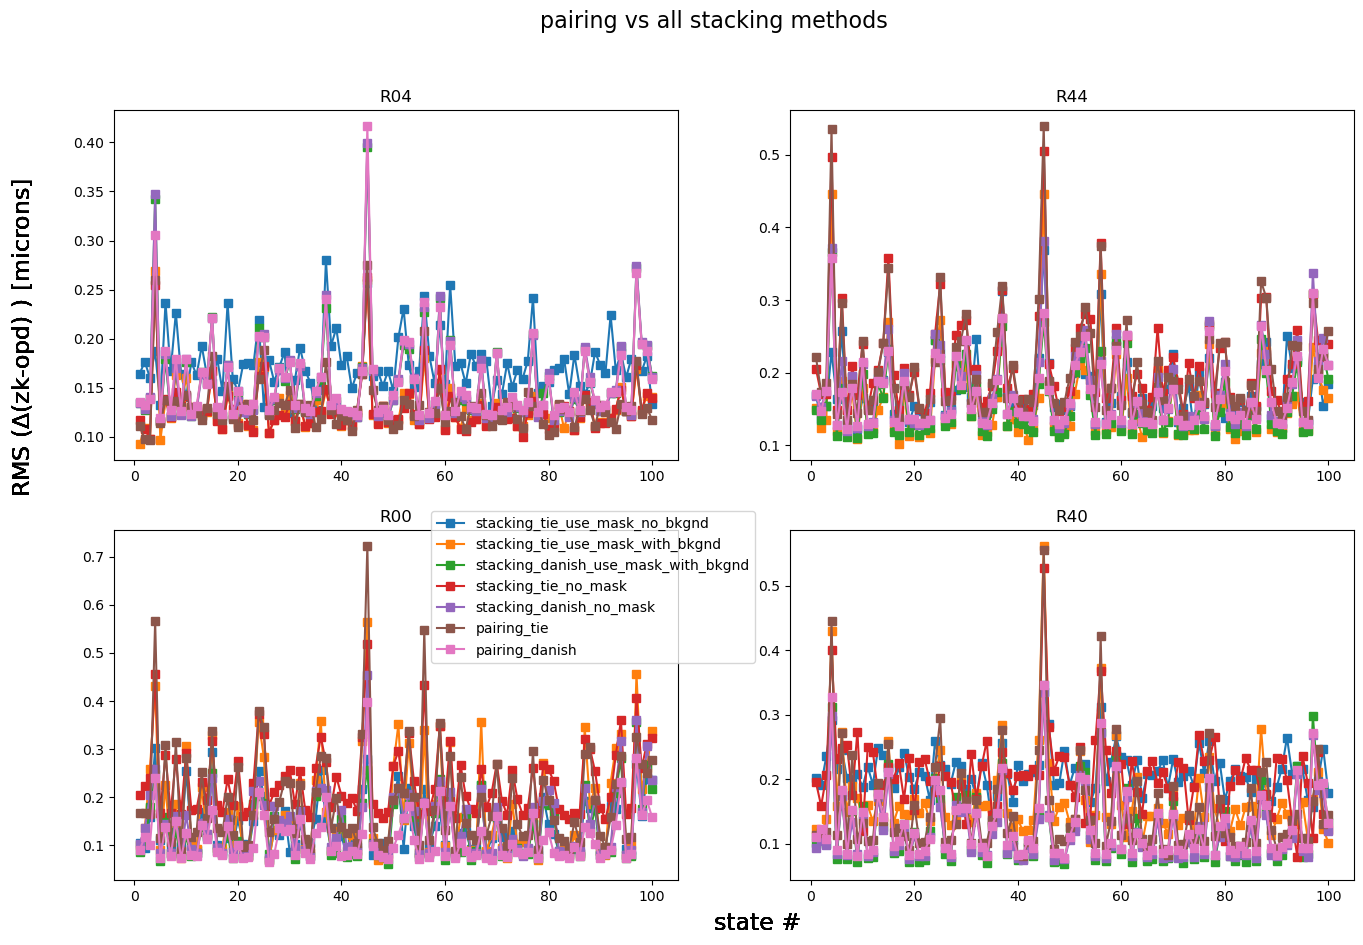
There is no clear preference for any particular method: while for R04 “stacking, TIE, with mask, no background” (blue) has the largest departure from the OPD, for R00 this is not the case. “Pairing Danish” (pink) has the smallest deviation from the OPD for R00, and is only marginally worse than the “stacking Danish with mask and background” (green) option for R44 and R40. To make it easier to see the deviation from the OPD, below we calculate the mean RMS difference across all states per detector per method:
means_arr = []
rafts_arr = []
methods_arr = []
for raft in rafts:
    for method in rmss.keys():
        mean_rms = np.median( rmss[method][raft])
        means_arr.append(mean_rms)
        rafts_arr.append(raft)
        methods_arr.append(method)
mean_rms_table = Table(data=[means_arr, rafts_arr, methods_arr], names=['mean_rms', 'raft', 'method'])
for raft in rafts:
    per_raft = mean_rms_table[mean_rms_table['raft'] == raft]# .sort('mean_rms')
    per_raft.sort('mean_rms')
    print(per_raft)
      mean_rms      raft                method
------------------- ---- -----------------------------------
0.12245982433194912  R04    stacking_tie_use_mask_with_bkgnd
0.12287115478025104  R04                stacking_tie_no_mask
 0.1272135180411988  R04                         pairing_tie
 0.1337388102052313  R04             stacking_danish_no_mask
 0.1342364041823671  R04 stacking_danish_use_mask_with_bkgnd
0.13711868256738124  R04                      pairing_danish
0.16788752144434005  R04      stacking_tie_use_mask_no_bkgnd
      mean_rms      raft                method
------------------- ---- -----------------------------------
0.13367654248935212  R44 stacking_danish_use_mask_with_bkgnd
0.13394723071818743  R44    stacking_tie_use_mask_with_bkgnd
0.15050260405928126  R44                      pairing_danish
 0.1521178698309197  R44             stacking_danish_no_mask
 0.1597151828776096  R44      stacking_tie_use_mask_no_bkgnd
 0.1836104280153719  R44                         pairing_tie
0.18693449833802006  R44                stacking_tie_no_mask
      mean_rms      raft                method
------------------- ---- -----------------------------------
0.09211418516055045  R00                      pairing_danish
 0.1066278700894988  R00 stacking_danish_use_mask_with_bkgnd
0.11628452906679443  R00             stacking_danish_no_mask
0.11727095036248558  R00      stacking_tie_use_mask_no_bkgnd
0.13644630985049472  R00    stacking_tie_use_mask_with_bkgnd
0.15912864847592118  R00                         pairing_tie
 0.2085669551915312  R00                stacking_tie_no_mask
      mean_rms      raft                method
------------------- ---- -----------------------------------
0.09740636512101784  R40             stacking_danish_no_mask
0.10266305805150648  R40 stacking_danish_use_mask_with_bkgnd
0.10726847179842722  R40                      pairing_danish
0.11828681239339955  R40                         pairing_tie
0.14696597370236864  R40    stacking_tie_use_mask_with_bkgnd
0.20589407061432713  R40                stacking_tie_no_mask
 0.2073340524989511  R40      stacking_tie_use_mask_no_bkgnd
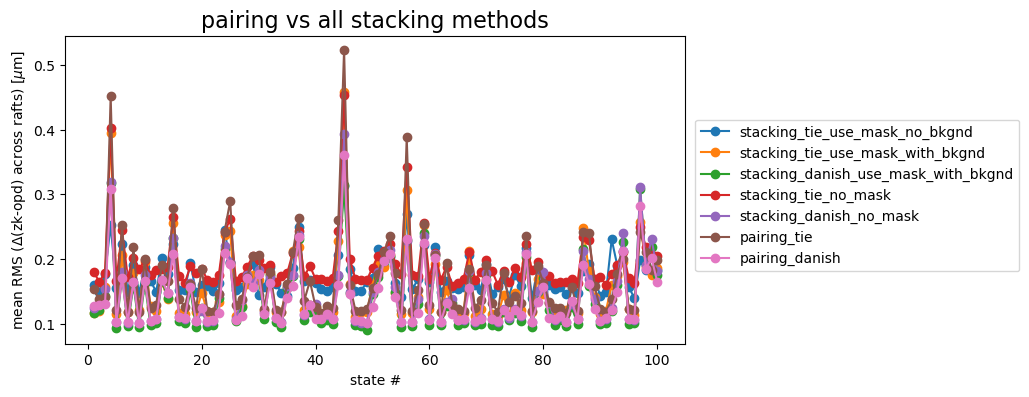
We can also marginalize across detectors, summarizing the RMS difference between each method taking the average per four sensors:
mean_per_state = {}
for method in rmss.keys():
    all_raft_data = []
    for raft in rafts:
        all_raft_data.append( rmss[method][raft])
    mean_per_state[method] = np.mean(all_raft_data,axis=0)
Plot per state:
fig,ax = plt.subplots(1,1,figsize=(8,4))
j=0
cmap = cmaps['tab10']
for method in mean_per_state.keys():

    ax.plot(np.arange(1,101), mean_per_state[method], marker='o', label=f'{method}',
           c=cmap(j))
    j+=1

ax.set_xlabel('state #')
ax.set_ylabel(r'mean RMS ($\Delta$(zk-opd) across rafts) '+r'[$\mu$m]',)
ax.set_title('pairing vs all stacking methods', fontsize=16)
ax.legend(bbox_to_anchor=[1.55,0.75])
<matplotlib.legend.Legend at 0x7f6653d325d0>
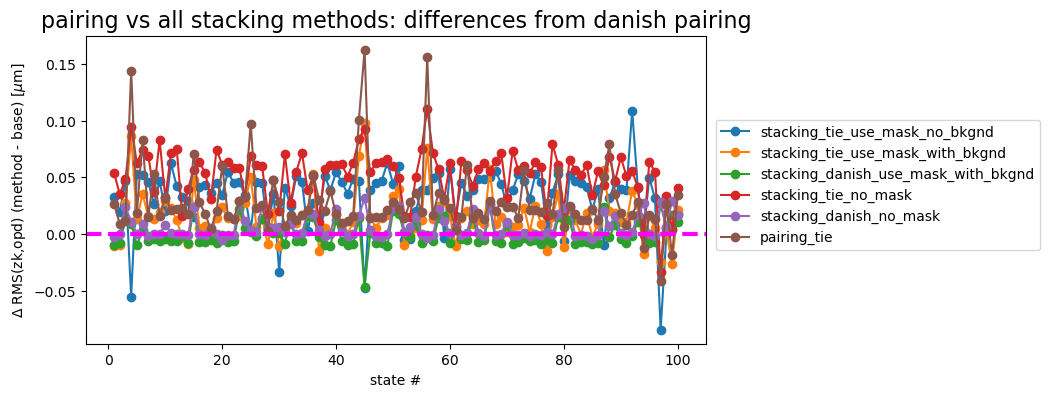
If we consider pairing with Danish as the default, the plot below shows the difference between Danish and other methods. The horizontal dashed line at \(\Delta=0\) is added for reference.
fig,ax = plt.subplots(1,1,figsize=(8,4))
j=0
base = mean_per_state['pairing_danish']
for method in mean_per_state.keys():
    if method != 'pairing_danish':
        diff = mean_per_state[method] - base
        ax.plot(np.arange(1,101), diff, marker='o', label=f'{method}', c=cmap(j))
    j+=1
ax.axhline(0,ls='--', lw=3, c='magenta')
ax.set_xlabel('state #')
ax.set_ylabel(r'$\Delta$ RMS(zk,opd) (method - base) '+r'[$\mu$m]',)
ax.set_title('pairing vs all stacking methods: differences from danish pairing', fontsize=16)
ax.legend(bbox_to_anchor=[1.55,0.75])
<matplotlib.legend.Legend at 0x7f66538ce0d0>
Show just the two pairing methods:
fig,ax = plt.subplots(1,1,figsize=(8,4))
j=0
for method in mean_per_state.keys():
    if method.startswith('pairing'):
        ax.plot(np.arange(1,101), mean_per_state[method], marker='o', label=f'{method}', c=cmap(j))
    j +=1
ax.set_xlabel('state #')
ax.set_ylabel(r'mean RMS ($\Delta$(zk-opd) across rafts '+r'[$\mu$m]',)
ax.set_title('pairing methods', fontsize=16)
ax.legend()
<matplotlib.legend.Legend at 0x7f6653c51bd0>
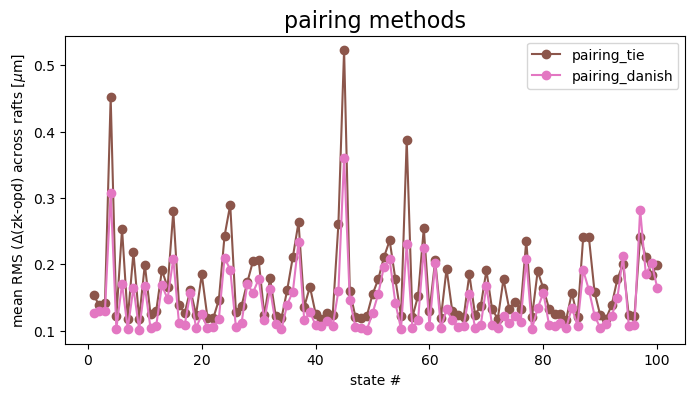
Danish appears to overall produce results closer to the OPD.
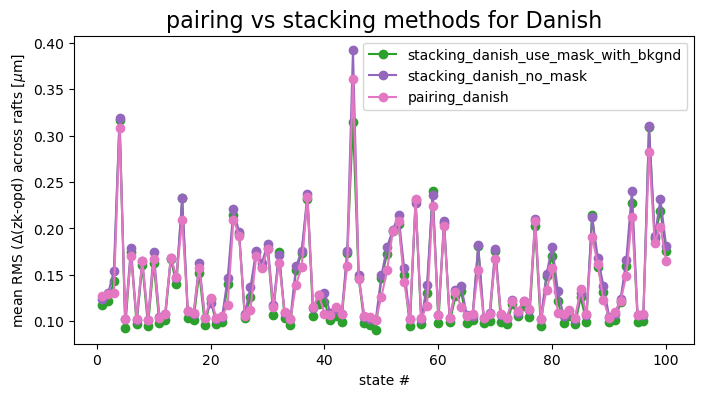
Most stacking results are not as good as pairing for Danish:
fig,ax = plt.subplots(1,1,figsize=(8,4))
j=0
for method in mean_per_state.keys():
    if 'danish' in method:
        ax.plot(np.arange(1,101), mean_per_state[method], marker='o', label=f'{method}', c=cmap(j))
    j +=1
ax.set_xlabel('state #')
ax.set_ylabel(r'mean RMS ($\Delta$(zk-opd) across rafts '+r'[$\mu$m]',)
ax.set_title('pairing vs stacking methods for Danish', fontsize=16)
ax.legend()
<matplotlib.legend.Legend at 0x7f6653ce1bd0>
This can be also shown as absolute differences:
fig,ax = plt.subplots(1,1,figsize=(8,4))
j=0
base = mean_per_state['pairing_danish']
for method in mean_per_state.keys():
    if 'danish' in method:
         if method != 'pairing_danish':
           diff = mean_per_state[method] - base
           ax.plot(np.arange(1,101), diff, marker='o', label=f'{method}', c=cmap(j))
           print('pairing_danish - ', method, ' mean difference: ', np.mean(diff), )
    j +=1
ax.set_xlabel('state #')
ax.set_ylabel(r'$\Delta$ RMS(zk,opd) (method - base) '+r'[$\mu$m]',)
ax.axhline(0,ls='--', lw=3, c='magenta')
ax.set_title('Difference between pairing and stacking methods for Danish', fontsize=16)
ax.legend()
pairing_danish -  stacking_danish_use_mask_with_bkgnd  mean difference:  0.0001616620313260622
pairing_danish -  stacking_danish_no_mask  mean difference:  0.0066782778509112024
<matplotlib.legend.Legend at 0x7f66538ccbd0>
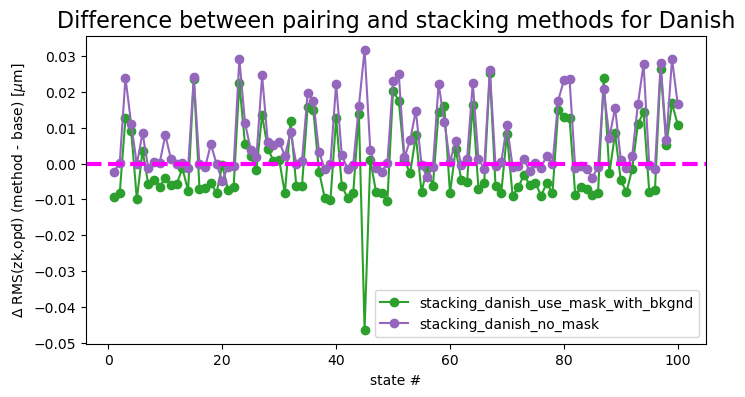
Thus for Danish, while with some states we may see decreased RMS when using stacking with mask and added mean background, for other states the same method performs more poorly than pairing. Averaging across all states, both stacking strategies are slightly worse than the pairing (at 0.1 nm - 6 nm mean level).
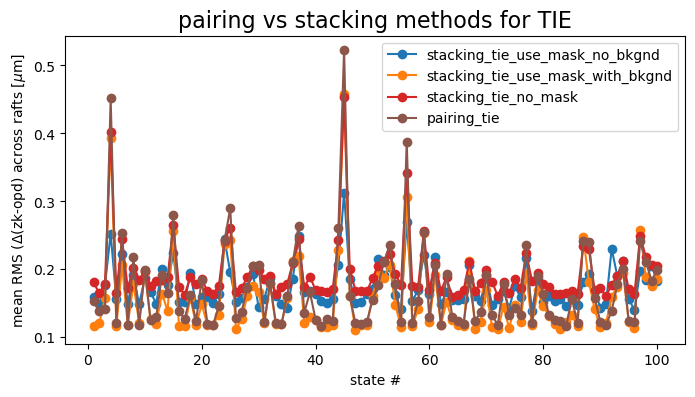
For TIE, stacking also does not provide statistically significant improvement over pairing, the RMS floor being around 0.09 \(\mu m\) for both approaches:
fig,ax = plt.subplots(1,1,figsize=(8,4))
j=0
for method in mean_per_state.keys():
    if 'tie' in method:
        ax.plot(np.arange(1,101), mean_per_state[method], marker='o', label=f'{method}', c=cmap(j))
    j +=1
ax.set_xlabel('state #')
ax.set_ylabel(r'mean RMS ($\Delta$(zk-opd) across rafts '+r'[$\mu$m]',)
ax.set_title('pairing vs stacking methods for TIE', fontsize=16)
ax.legend()
<matplotlib.legend.Legend at 0x7f6653a01bd0>
We similarly can show the difference between pairing and stacking:
fig,ax = plt.subplots(1,1,figsize=(8,4))
j=0
base = mean_per_state['pairing_tie']
for method in mean_per_state.keys():
    if 'tie' in method:
         if method != 'pairing_tie':
           diff = mean_per_state[method] - base
           ax.plot(np.arange(1,101), diff, marker='o', label=f'{method}', c=cmap(j))
           print('pairing_tie -', method, ' mean difference: ', np.mean(diff), )
    j +=1
ax.axhline(0,ls='--', lw=3, c='magenta')
ax.set_xlabel('state #')
ax.set_ylabel(r'$\Delta$ RMS(zk,opd) (method - base) '+r'[$\mu$m]',)
ax.set_title('pairing vs stacking methods for TIE', fontsize=16)
ax.legend()
pairing_tie - stacking_tie_use_mask_no_bkgnd  mean difference:  0.004362085537256819
pairing_tie - stacking_tie_use_mask_with_bkgnd  mean difference:  -0.013307982598863802
pairing_tie - stacking_tie_no_mask  mean difference:  0.023729023100608534
<matplotlib.legend.Legend at 0x7f6653761bd0>
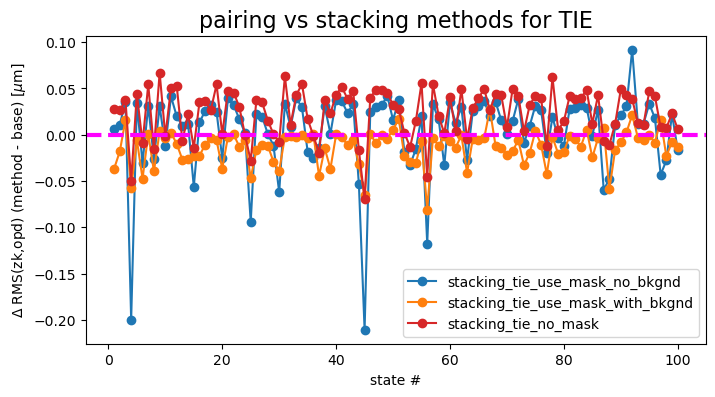
These differences oscillate around 0, with “stacking with TIE without mask” (red) as well as “stacking with mask with background” being on average above 0 (i.e. larger RMS departure from OPD than the baseline pairing approach). Stacking with mask and background performs marginally better than pairing for some states. (mean 0.01 \(\mu m\) below pairing).
In summary, based on the WET-001 simulation we do not see that there is a clear advantage in introducing stacking over using the existing approach of pairing.